contours() creates a contour plot of a state-variable computed by the analytic element
model aem, or adds the contour lines to an existing plot.
Usage
contours(
  aem,
  x,
  y,
  variable = c("heads", "streamfunction", "potential"),
  asp = 1,
  ...
)
Arguments
- aem
aemobject.- x
numeric, vector or marginal x coordinates at which the gridded values are computed. These must be in ascending order.
- y
numeric, vector or marginal y coordinates at which the gridded values are computed. These must be in ascending order.
- variable
character indicating which state-variable to plot. Possible values are
heads(default),streamfunctionandpotential.- asp
the
y/xaspect ratio, seeplot.window(). Defaults to 1 (equal unit lengths).- ...
additional arguments passed to
contour().
Details
contours() is a wrapper around contour(). It obtains the values of variable at
the grid points defined by marginal vectors x and y and constructs the matrix supplied to contour() by reversing the rows and
transposing the matrix (see also the documentation of image()).
Examples
w <- well(xw = 50, yw = 0, Q = 200)
wi <- well(xw = -200, yw = 0, Q = -100)
uf <- uniformflow(gradient = 0.002, angle = -45, TR = 100)
rf <- constant(-1000, 0, hc = 10)
ml <- aem(k = 10, top = 10, base = 0, n = 0.2, w, wi, uf, rf)
# grid points
xg <- seq(-350, 200, length = 100)
yg <- seq(-125, 125, length = 100)
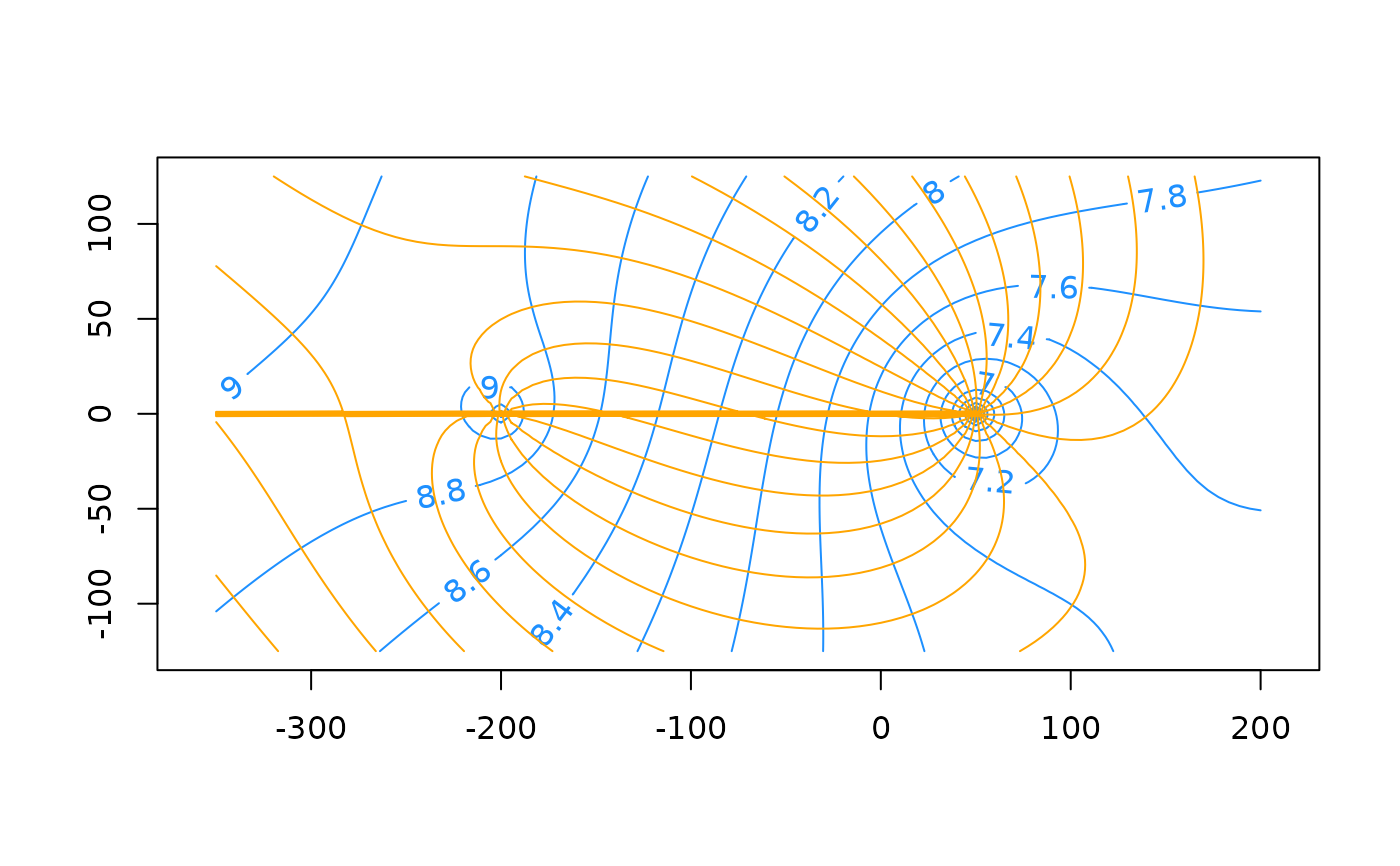
contours(ml, xg, yg, nlevels = 20, col = 'dodgerblue', labcex = 1)
contours(ml, xg, yg, 'streamfunction', nlevels = 20, col = 'orange',
drawlabels = FALSE, add = TRUE)
 # Not to be confused by contour()
try(
contour(ml, xg, yg, nlevels = 20, col = 'dodgerblue', labcex = 1)
)
#> Error in contour.default(ml, xg, yg, nlevels = 20, col = "dodgerblue", :
#> no proper 'z' matrix specified
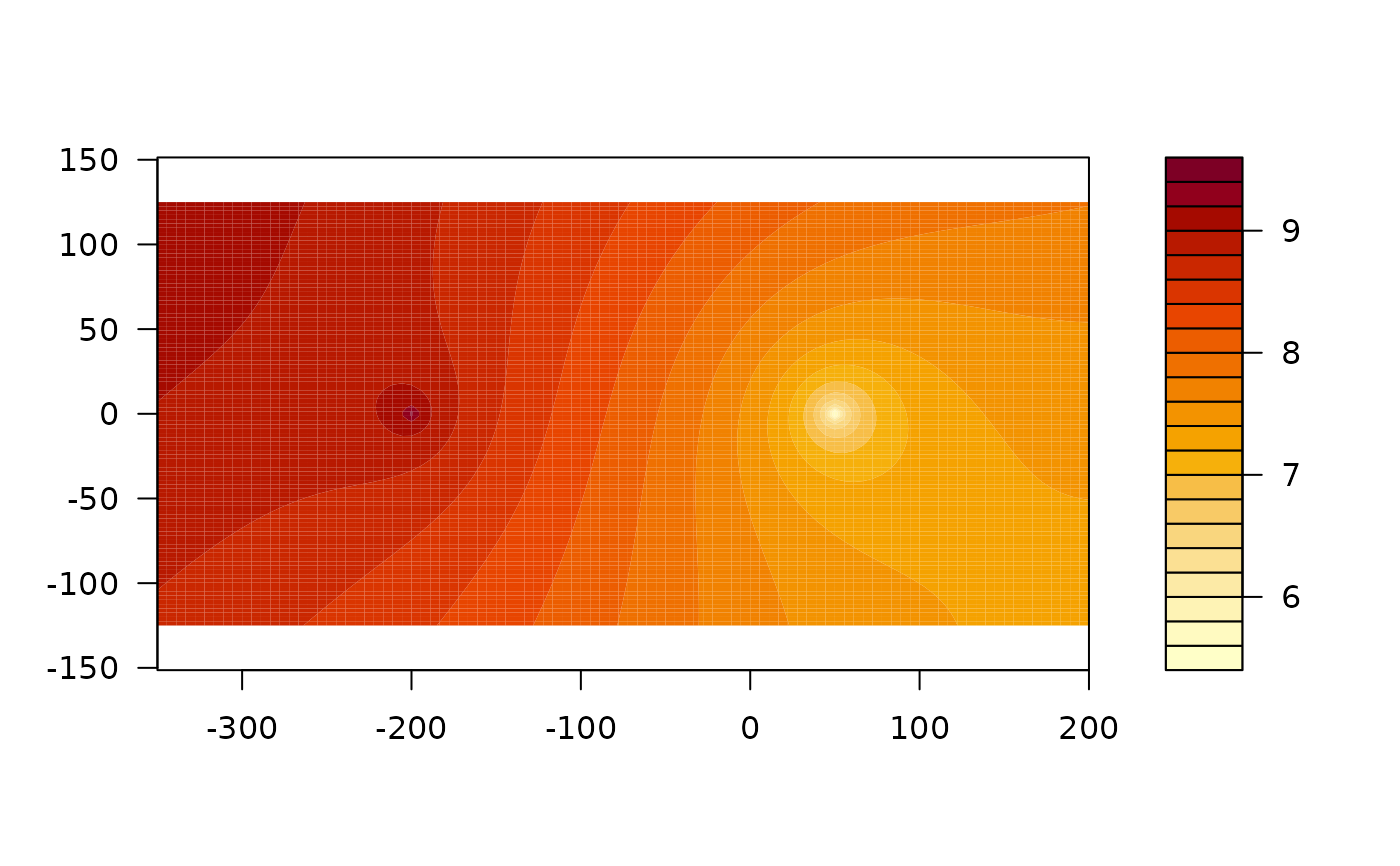
# For image() or filled.contour()
library(graphics)
h <- heads(ml, xg, yg, as.grid = TRUE)
h_im <- t(h[dim(h)[1]:1,])
image(xg, yg, h_im, asp = 1)
contour(xg, yg, h_im, asp = 1, add = TRUE) # contours() is a wrapper for this
# Not to be confused by contour()
try(
contour(ml, xg, yg, nlevels = 20, col = 'dodgerblue', labcex = 1)
)
#> Error in contour.default(ml, xg, yg, nlevels = 20, col = "dodgerblue", :
#> no proper 'z' matrix specified
# For image() or filled.contour()
library(graphics)
h <- heads(ml, xg, yg, as.grid = TRUE)
h_im <- t(h[dim(h)[1]:1,])
image(xg, yg, h_im, asp = 1)
contour(xg, yg, h_im, asp = 1, add = TRUE) # contours() is a wrapper for this
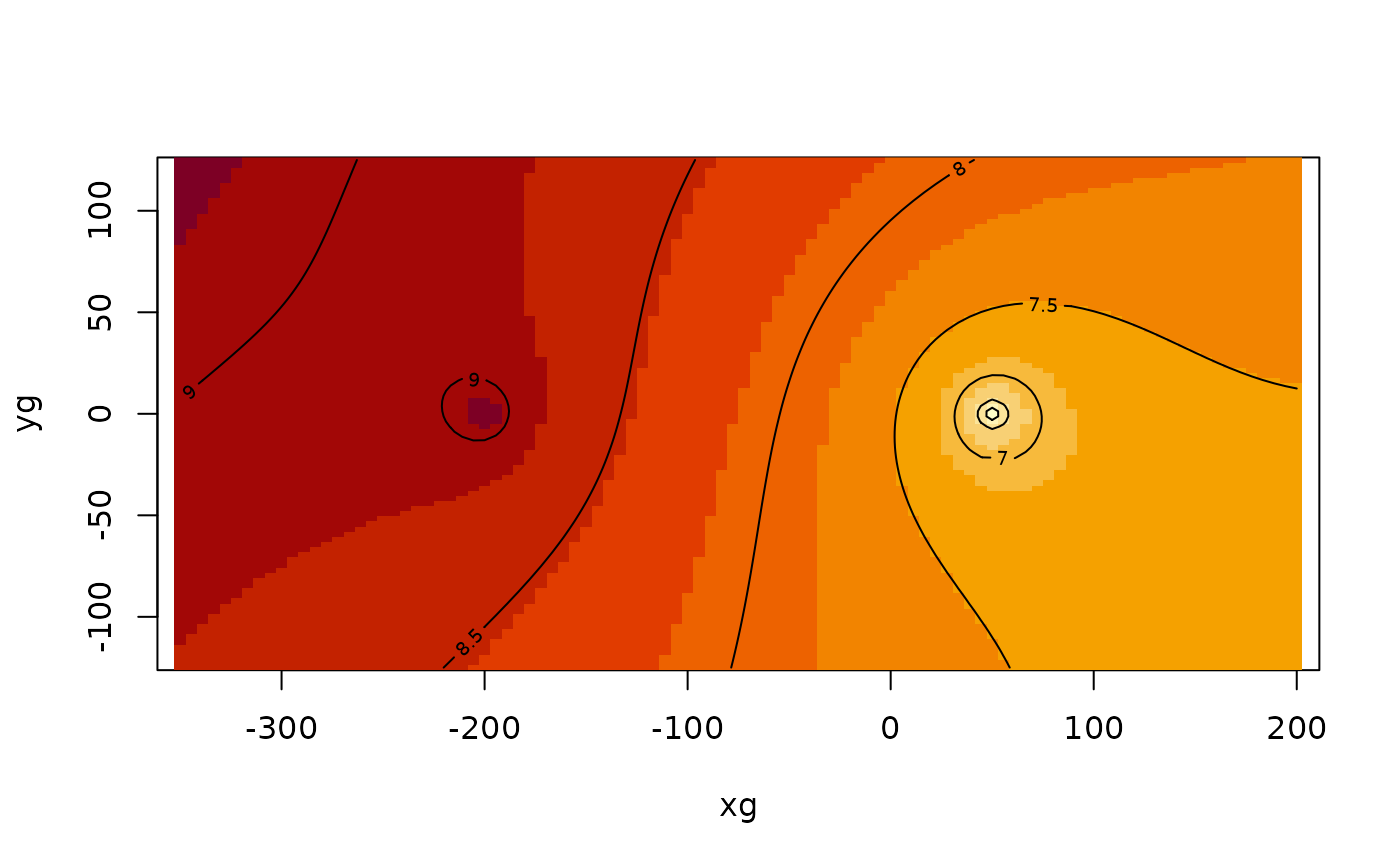 filled.contour(xg, yg, h_im, asp = 1)